Building a CO₂ Monitor with Python on a Raspberry Pi
A few weeks ago I was scrolling through my twitter feed and happened upon this twitter thread from a friend and sometimes colleague Adam Ginsburg, an astronomer at the National Radio Astronomy Observatory and soon to be a professor at the University of Florida.
I’ve definitely experienced situations where I had to sit in a room with lots of people and felt more and more tired the longer I spent in the room. I had never considered that this is more than just being bored, that there might be a physiological reason for this feeling. This tweet led me to some discussion from Adam Ginsburg, an astronomer at the National Radio Astronomy Observatory who I know from my previous life as an astrophysicist, about how he set this up and where to buy the CO2 sensor.
It turns out it’s pretty easy to measure the CO2 concentration in a room using a sensor that speaks to a computer over a USB connection, in particular the website co2meter.com sells a small desktop model for $80 plus shipping, with prettier models starting at $100. It was definitely an impulse purchase but a few clicks later I was the proud owner of a brand new CO2 meter. In my defense the washington post also thought this was pretty cool.
What does the research say?
Very high levels of carbon dioxide can lead to such unpleasant effects as a racing heart, arrhythmia, blurred vision, and impaired consciousness. Very high levels, above 10% concentration (100,000 PPM) can cause convulsions, coma, and death. NASA engineers famously had to figure out how to adapt CO2 scrubbers intended for the command module to function correctly on the lunar module to save the astronauts on Apollo 13 from such a fate.
In the last 10 years research has started to emerge that low but elevated levels of carbon dioxide, perhaps above 1000 PPM, and definitely above 2000 PPM can have measurable cognitive impacts. As far as I can see with my brief literature search (see also this review compiled by Berkeley Lab), research in this area is mixed, with some high quality studies showing cognitive impacts and other equivalently high quality research showing no impacts. Further research is likely needed in larger samples more representative of the broader population to be sure. However given those caveats, the effects in some of the existing studies are dramatic for certain kinds of cognitive tests, especially when the CO2 concentration is as much as 5 to 10 times above a typical background level of 400 PPM in the atmosphere. It’s also entirely anecdotal, but these results also jibe with my personal experience, I often get sleepy and distracted in crowded, poorly ventilated areas.
Getting data from the CO2 meter
To talk to the CO2 from a computer you can use the co2meter Python
package that is available on github
and installable via pip. This package
talks to the USB interface using the hidapi
interface, in this case using a Cython
wrapper around hidapi. To get this
working on a Linux machine, you will need to install a few packages. On Ubuntu
18.04, I had to do:
$ sudo apt-get install libusb-1.0-0-dev libudev-dev
$ sudo pip install hidapi co2meter
I also needed to set up udev rules for the device interface. The following
content in a file name /etc/udev/rules.d/98-co2mon.rules worked for me:
SUBSYSTEM=="usb", ATTRS{idVendor}=="04d9", ATTRS{idProduct}=="a052", GROUP="plugdev", MODE="0666"
KERNEL=="hidraw*", ATTRS{idVendor}=="04d9", ATTRS{idProduct}=="a052", GROUP="plugdev", MODE="0666"
and then reload the udev rules:
$ sudo udevadm control --reload-rules && udevadm trigger
To check that everything is working, do the following:
$ sudo python -c "import co2meter as co2;mon = co2.CO2monitor();print(mon.info)"
Assuming everything is working correctly, you should see output like this:
{'product_name': u'USB-zyTemp', 'vendor_id': 1241, 'serial_no': u'1.40', 'product_id': 41042, 'manufacturer': u'Holtek'}
See the co2meter documentation for
more details if you don’t use Ubuntu.
I was only able to get this working by connecting to the USB interface as root, it’s probably possible to adjust these rules to make the interface available to all users. Since I was ultimately doing this on a machine on the Recurse Center LAN that would not be exposed to the internet I didn’t worry too much about figuring out how to avoid mandating gathering the data using root privileges. Any suggestions to fix this would be very appreciated.
Making it work on a Raspberry Pi
My ultimate goal was to make a liveplot that people can check throughout the day to see the CO2 concentration over time, making it easier to spot when the air is getting stuffy. That means I can’t just attach the meter to my laptop while I’m around RC, it needs to be running 24 hours a day in some out-of-the-way spot. Thankfully the Recurse Center is lousy with Raspberry Pis - there’s a box of them along with some Parallella and Arduino boards in the closet - and I was able to scrounge up a Raspberry Pi 3 that was gathering dust.
I’ve never really messed with a Raspberry Pi before and it was a fun experience getting it set up. I did need to buy a micro-SD card from Target to boot the Raspberry Pi operating system from. I also wasted time trying to find an SD card reader for a couple hours before realizing that my Dell XPS 13 laptop has a built-in microSD card reader. After inserting the card into my laptop I flashed a build of raspbian onto the card using Etcher and booted the Pi and connected the Pi to the CO2 meter over USB. I then had to repeat the setup steps I did on my laptop to gather the measurements from the meter. Since the Pi runs on an ARM chip, it’s a little bit harder to set up a custom python environment without compiling everything from scratch which takes ages on the Pi’s slow CPU and limited memory. Thankfully there are Debian Arm64 builds of all the dependencies I needed so this wasn’t much trouble. Some of the packages on Raspbian Stretch are old and I needed to work around bugs and behavior differences in the versions of libraries I could easily use on the Pi compared with the more recent versions I had on my laptop. Since I set up my Pi, Raspbian Buster came out, along with more up-to-date packages in the package manager, so this wouldn’t be a problem this week like it was when I was putting this together last week.
Gathering and liveplotting data
The code for this part lives in a repository on my GitHub called
rc-co2monitor. There are two main
pieces, a script called gather_data.py that gathers the measurements from the
USB interface, saves it, and generates a plot using matplotlib. The second
piece is a very simple flask webapp that exposes the matplotlib plot as
content in a webpage that people on the Recurse Center LAN can access. This is a
very bare-bones, not at all fancy setup and there’s probably lots of room to
improve aesthetics, the data display, how the data are saved and stored, and to
improve reliability in case the Pi crashes.
The main loop that generates a data gathering event and creates a plot looks like this:
if __name__ == "__main__":
    import co2meter

    while True:
        tb = time.time()
        mon = co2meter.CO2monitor()
        now = pandas.Timestamp.now()
        output_filename = "{}-{}-{}.csv".format(now.year, now.month, now.day)
        if not os.path.exists(output_filename):
            with open(output_filename, "w") as f:
                f.write("Time,Concentration,Temperature\n")
        data = mon.read_data()
        t = time.mktime(data.index[0].timetuple())
        row = t, np.float64(data["co2"]), np.float64(data["temp"])
        print("{}, {} PPM, {} °C".format(*row))
        with open(output_filename, "a") as f:
            writer = csv.writer(f)
            writer.writerow(row)
        make_plot()
        tsleep = 60 - (time.time() - tb)
        if tsleep > 0:
            time.sleep(tsleep)
I set up an infinite loop that once every 60 seconds reads data from the CO2 meter, saves it to a CSV file (and creates the file if it doesn’t yet exist), generates a plot, and then waits until 60 seconds have passed. Each CSV file only contains one day worth of data. I could have used a database for this but it seemed simpler to keep everything human readable.
I’m importing co2meter here instead of at module level to make it possible to
create plots of the data without having access to a CO2 meter on a
USB interface, this eases debugging on my laptop.
To plot the data I gather all data captured within the last 4.5 days an then
plots it using Matplotlib. I spent some time tweaking the plot to make it look
nice and for the temperature data recorded by the meter made sure to plot using
both Fahrenheit and Celsius scales for the benefit of the many recursers who are
not from the USA. The code to generate the plots is a little too verbose to
include here in this blog post but you can take a look at it on GitHub if you’re
curious. The hardest piece of this was - surprisingly to me - localizing the
timestamps I write to the CSV file and adjusting things to be in the US/Eastern
timezone. I’ve never really worked with timeseries data that’s associated with
dates and I’m sure plenty of readers are not surprised this was surprisingly
subtle. I ended up heavily using the pandas timetamp and datetime machinery,
which worked although it wasn’t terribly ergonomic for me.
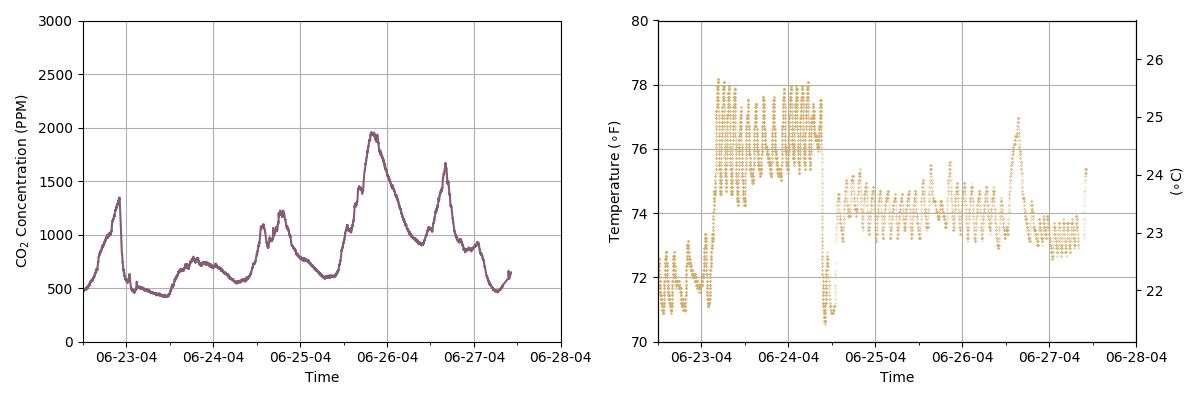
Here’s what the plot looks like in the end:

There are definitely spikes in the CO2 concentration in the afternoons. The 25th was a very hot day and opening the windows wasn’t really an option, however earlier in the week people noticed that the CO2 concentration was getting high and opened the windows, preventing a very large spike from developing. You can also see how when people opened the windows on the 26th, another hot day, the temperature spiked. Unfortunately over the Summer it’s a bit of a tradeoff between being comfortable in terms of temperature and comfortable in terms of stuffy air.
Recurse Center community reaction
Since I set the CO2 meter up people have started opening up the windows in the afternoon so I think it’s having a real effect, although we’ll see how people react once the CO2 concentration is high and it’s hot and humid outside. I also presented the monitor project in a lightning talk. Afterwards one of the of the Recurse Center asked me what they should do about the high CO2 concentration. I didn’t really have any great answers besides perhaps buying more plants for the space, although I think to really make a dent one would need to buy a lot of plants or perhaps acquire some vats of algae.
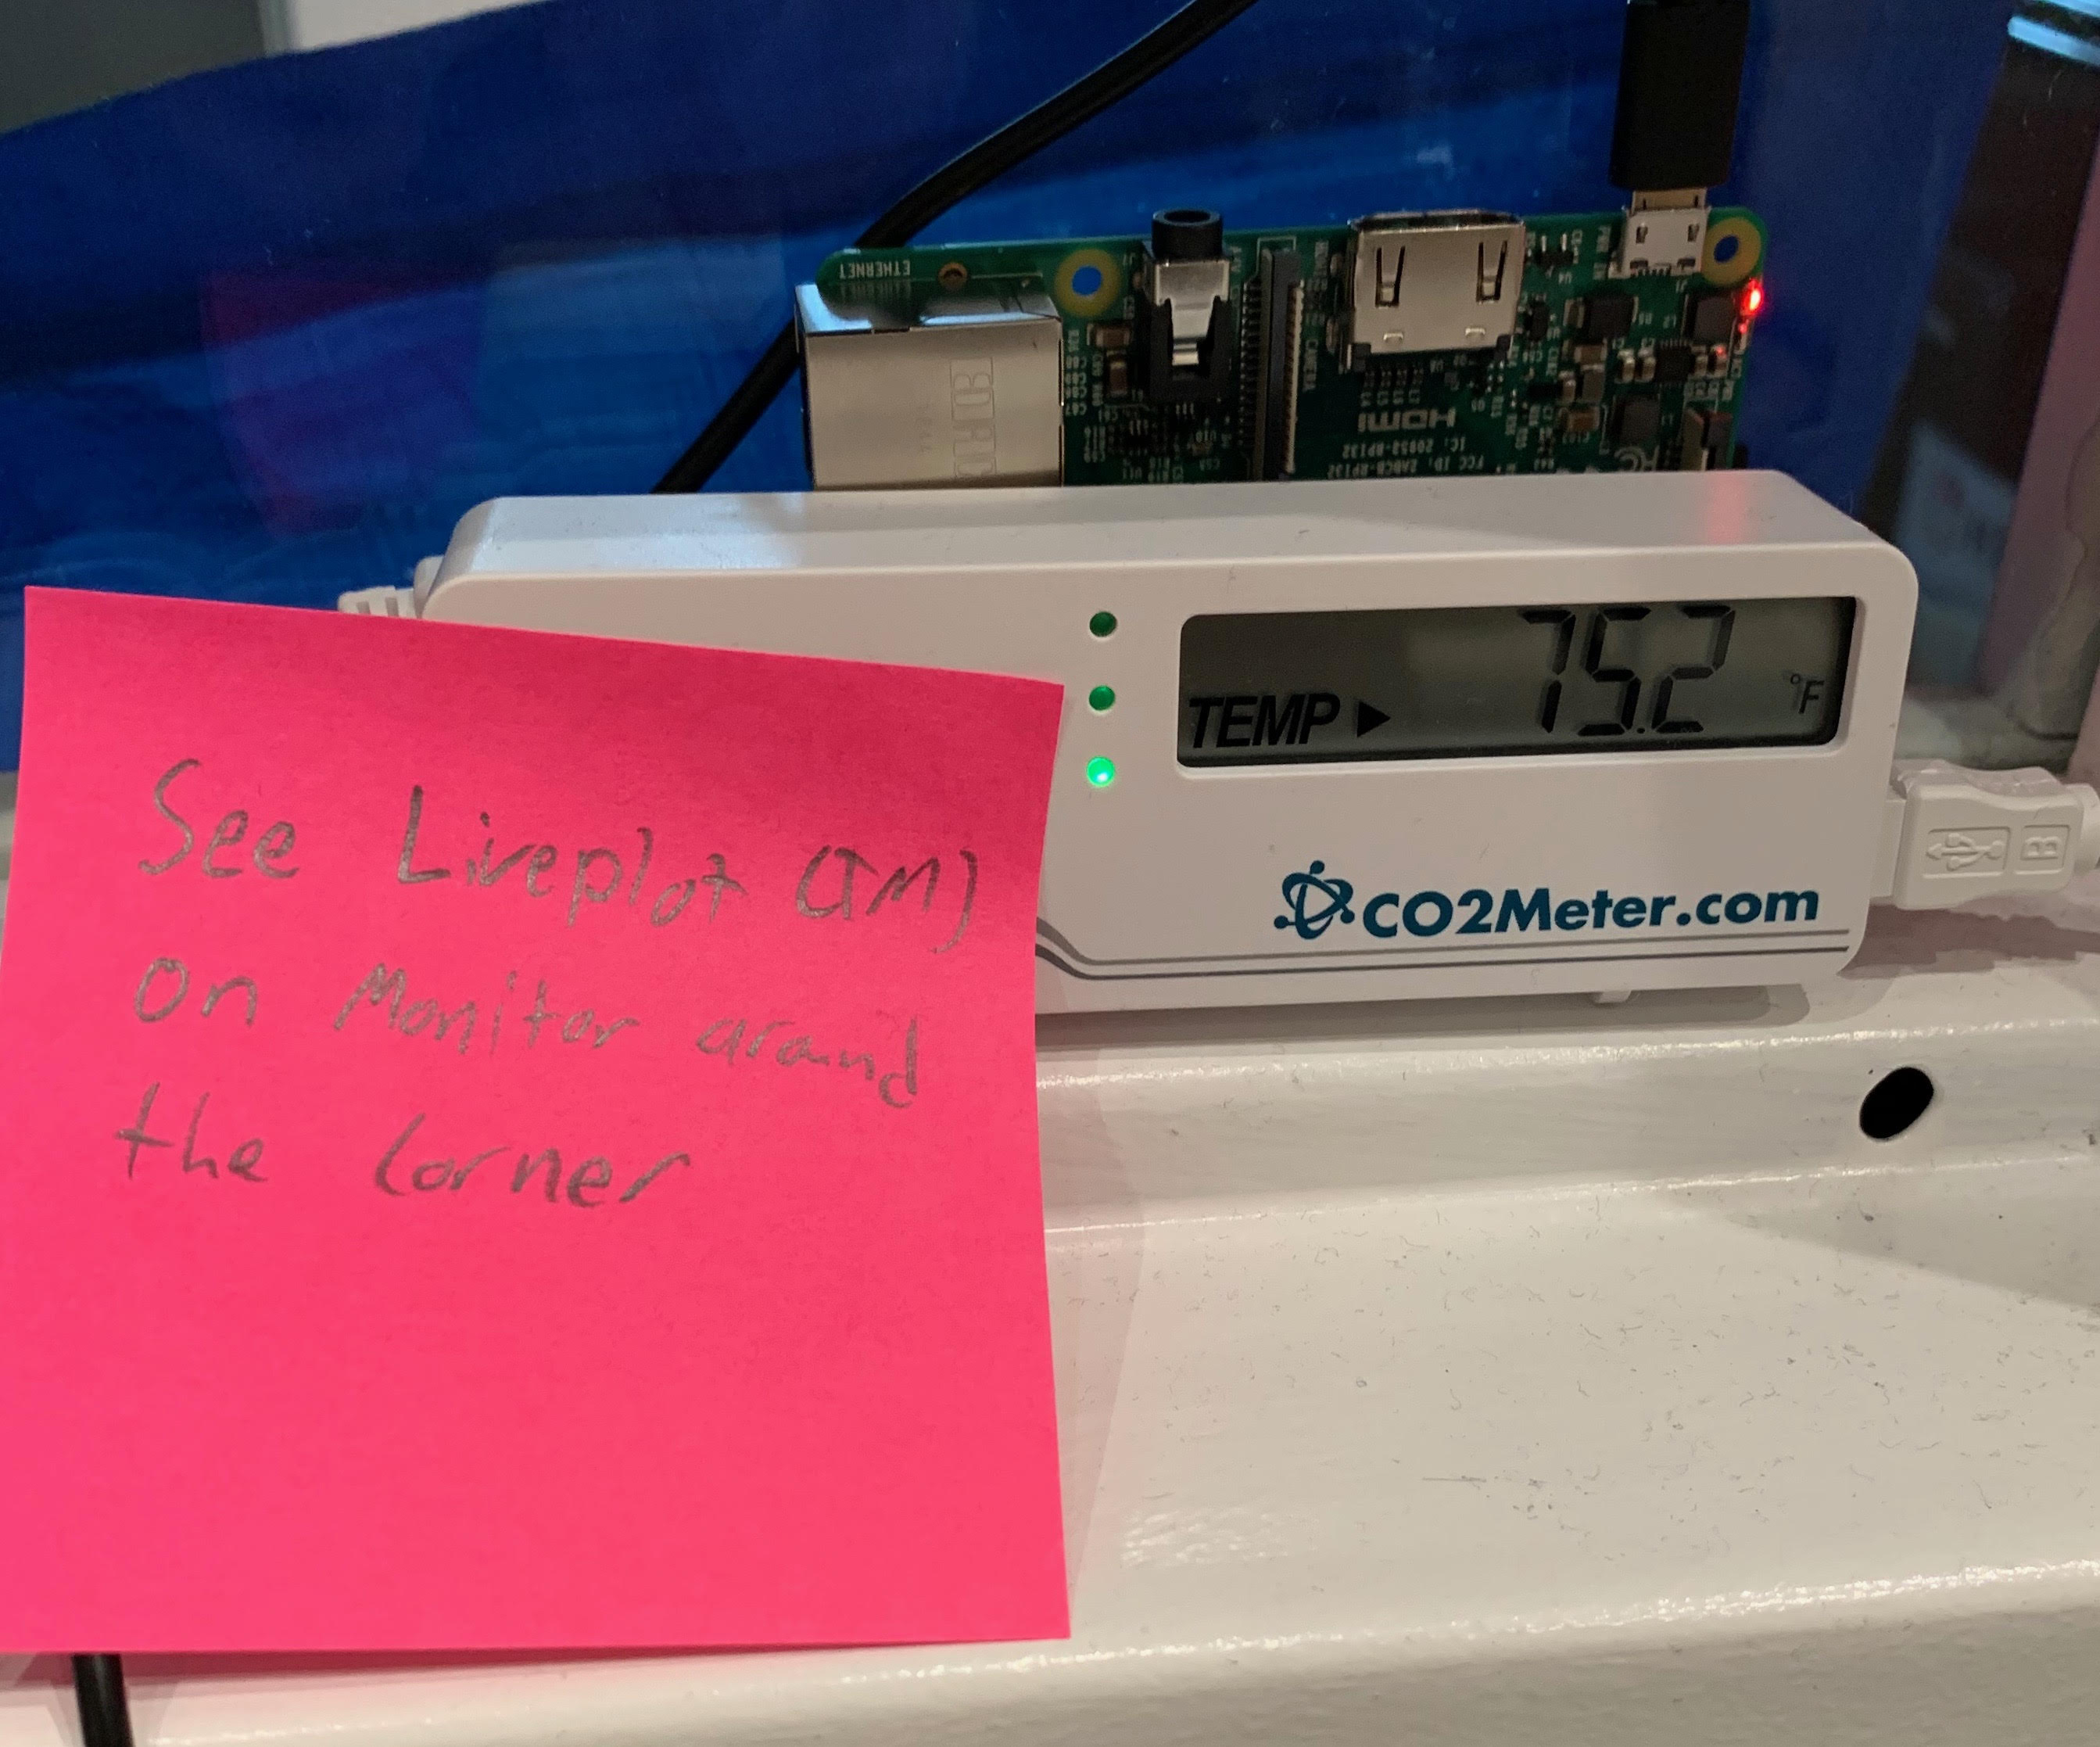
In the end I think this was a success. Hopefully this project will be able to continue running in the space even after I leave. I’m planning to watch out for crashes and see if I can find ways to make it work without any human intervention since there’s no guarantee anyone will want to work on this after I leave. If you’re curious what this looks like in the space, here’s a little portrait of the full setup:
